

Last Updated on February 3, 2024
Need to create a Gantt chart?
In this guide, I will show you an easy method to create a Gantt chart in SharePoint Online using JSON.
Let’s get started.
Table of Contents:
What are Gantt charts?
Gantt charts are quite handy in project planning and management since they show a timeline and task progression.
If you have already seen a Gantt chart, you know that they’re basically progress bar charts that represent a project’s schedule.
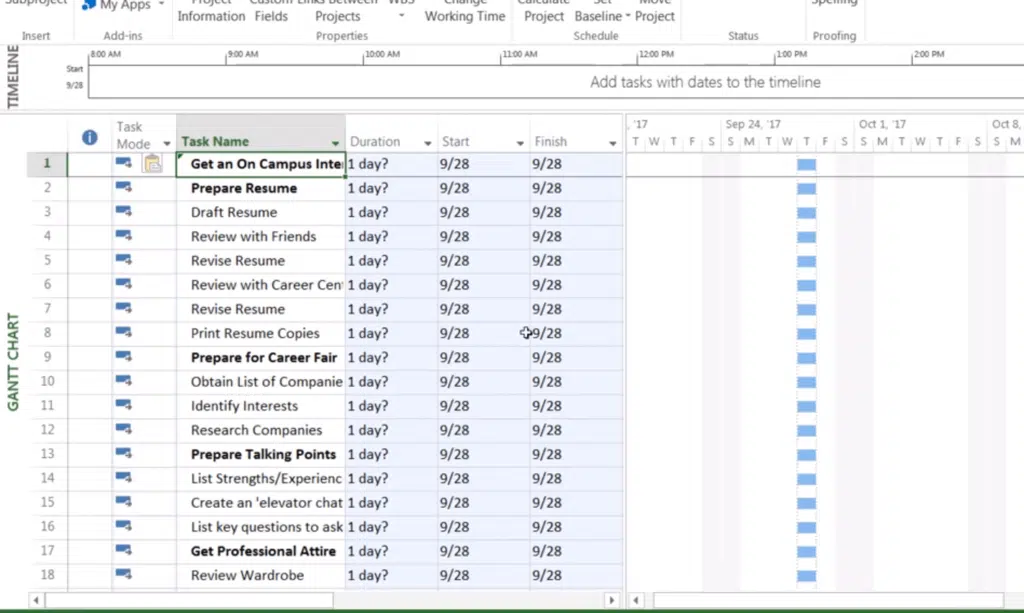
You can easily create one in Microsoft’s app for project management — Microsoft Project — quite easily:
There was also a functionality for it in the classic experience of SharePoint.
Unfortunately, Gantt and other SharePoint features haven’t reached the modern experience yet.
Related: Microsoft Project Tutorial: Introductory Guide for Newbies
Sign up for exclusive updates, tips, and strategies
The good news is that you can still create a Gantt chart in a list by using JSON formatting in a column.
There are a lot of list formatting templates available that you can check out — and we will be using one today.
Step 1: View requirements
To kick things off, I decided to use this formatting from GitHub since a lot easier to implement and understand.
The basic requirements here are to have the following columns in the view:
- Start DateTime
- End DateTime
Naturally, you can have any other columns in the list — but these have to be present — and set to “required”.
Step 2: Set up the list
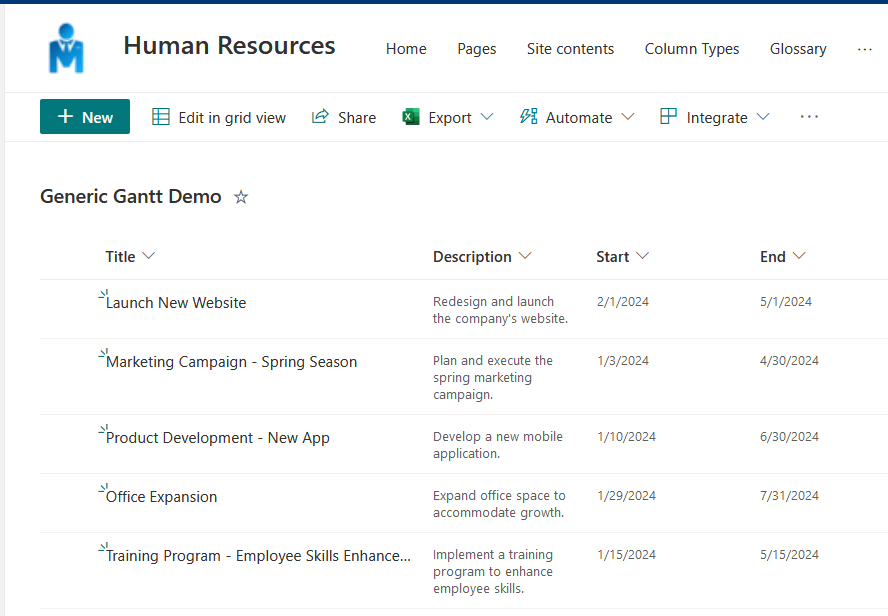
What you need to do here now is to create a list with the required columns.
I created a demo list and here’s what it looks like:
Finally, add a text column (single line) for the Gantt chart.
The formatting has two types:
- Gantt chart
- Gantt chart with today
I will create both columns to show you what they look like.
In case you want to embed the list to a SharePoint page, the formatting would still work.
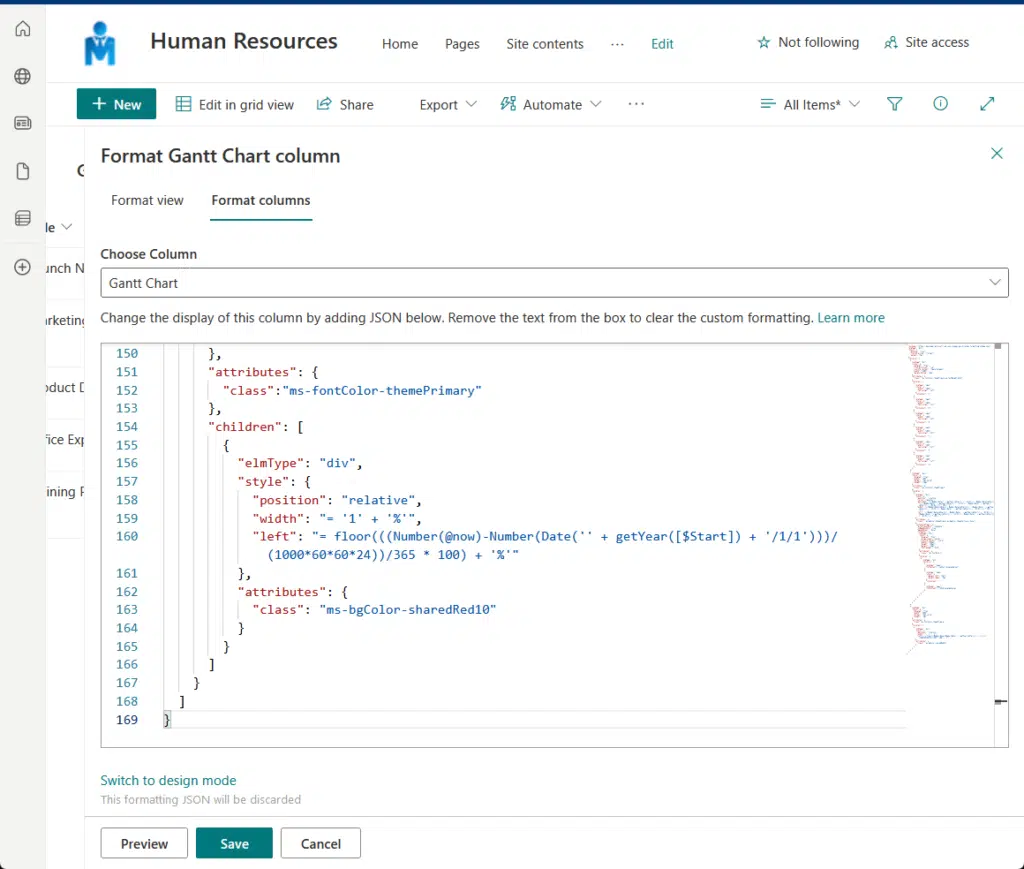
Step 3: Format the Gantt chart column
From here, all we have to do is format the column.
Click on the column heading > column settings > format this column button:
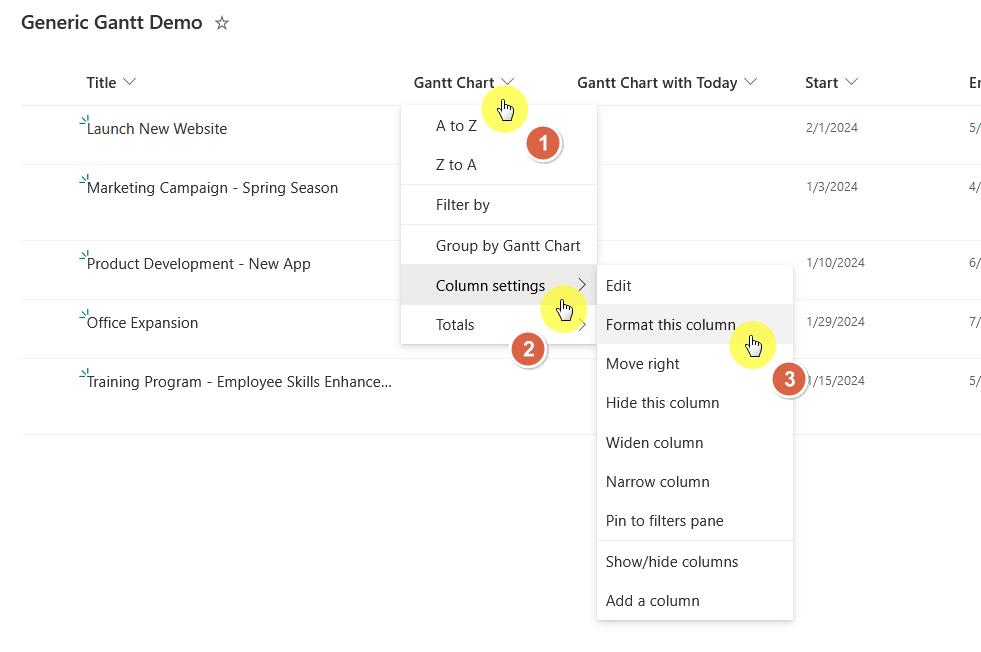
This will open the format panel on the right side.
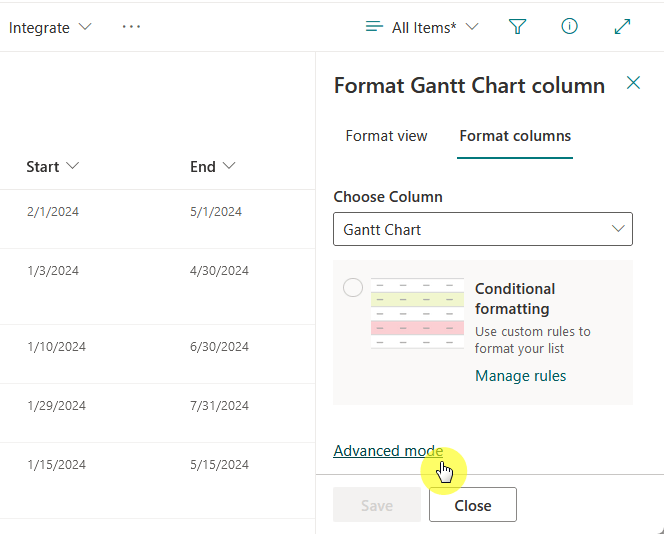
Click the advanced mode on the bottom of the panel:
Step 4: Apply JSON formatting
Now all you have to do is copy and paste the JSON code from GitHub.
You can easily navigate to the codes from the home page of the project.
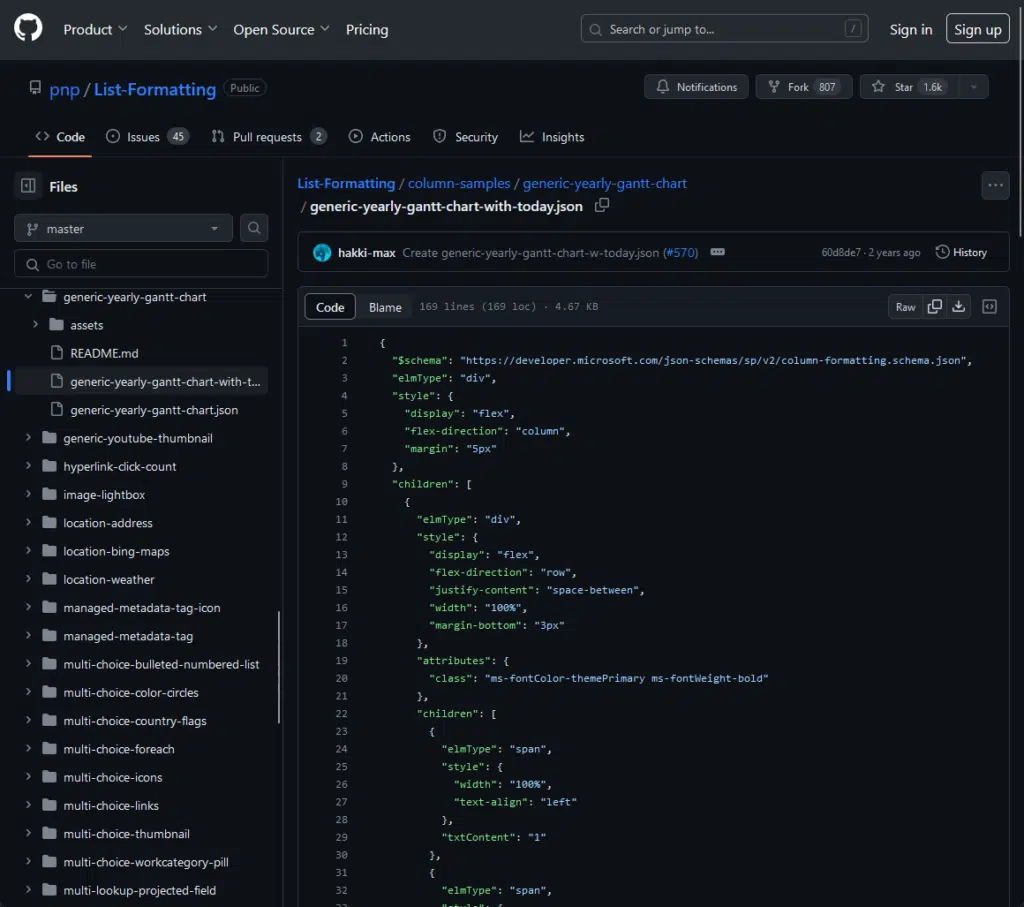
Back to SharePoint, replace the current JSON with the one from GitHub.
Then click the save button:
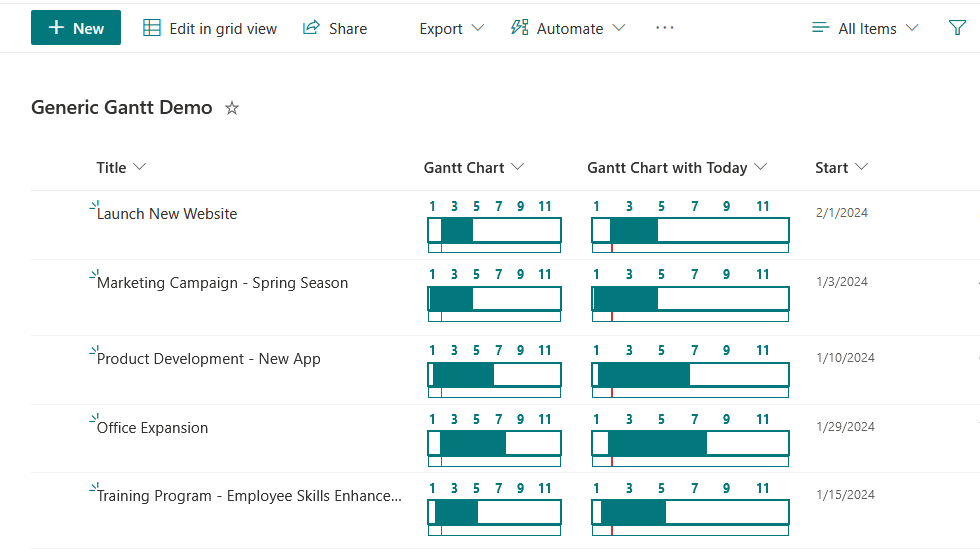
It will automatically generate the Gantt chart for you.
Here’s what those charts look like:
If you know some code, you can always edit it to customize the chart even further.
Note: In case the list has multiple views or charts, you can also create a specific Gantt chart view.
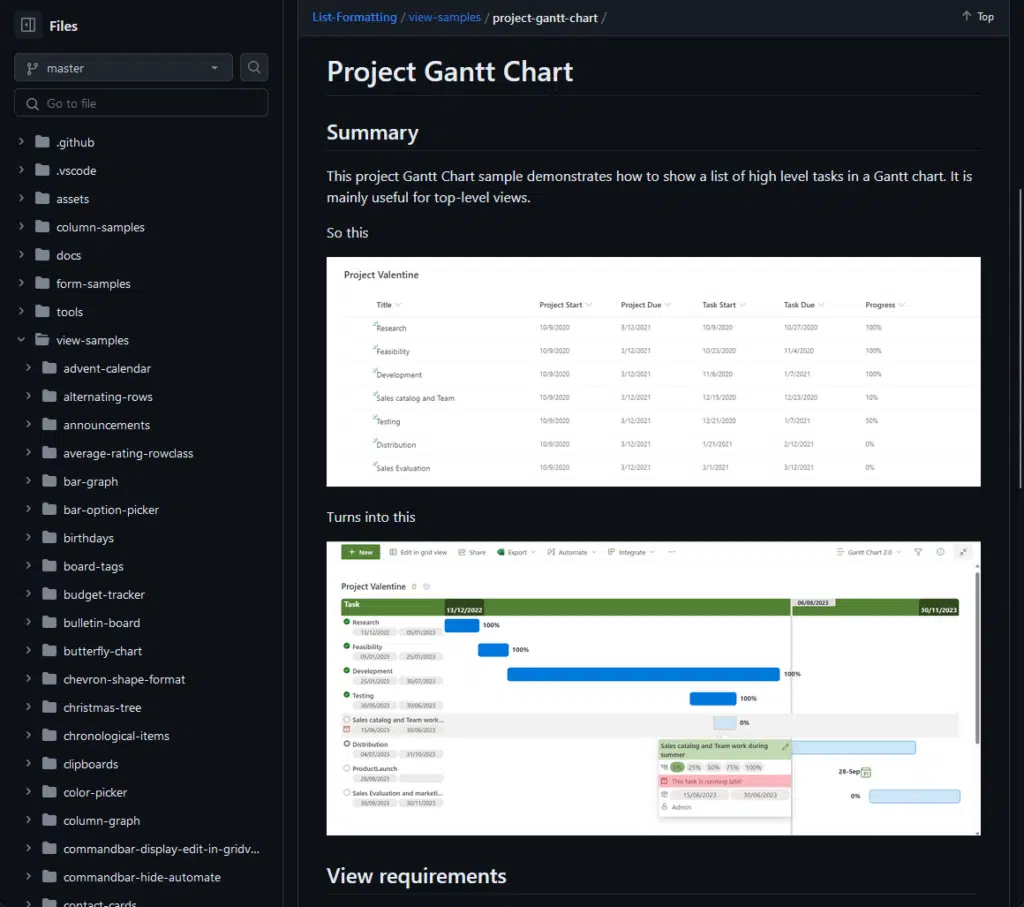
Other Gantt Chart Templates
The example I showed you above is the most basic.
There are other Gantt chart list formatting in GitHub, just look for them.
For example, this one shows a list of high-level tasks and lets you achieve a look close to Microsoft Project.
If you have more questions about creating a Gantt chart in SharePoint, feel free to leave a comment.
For further inquiries or business concerns, kindly use the site’s contact form. I’ll respond promptly.


Hello! I tried using the code for that last example (that looks like Microsoft Project) and I can’t seem to get it to work. Any tips?
Try chat GPT to help you..